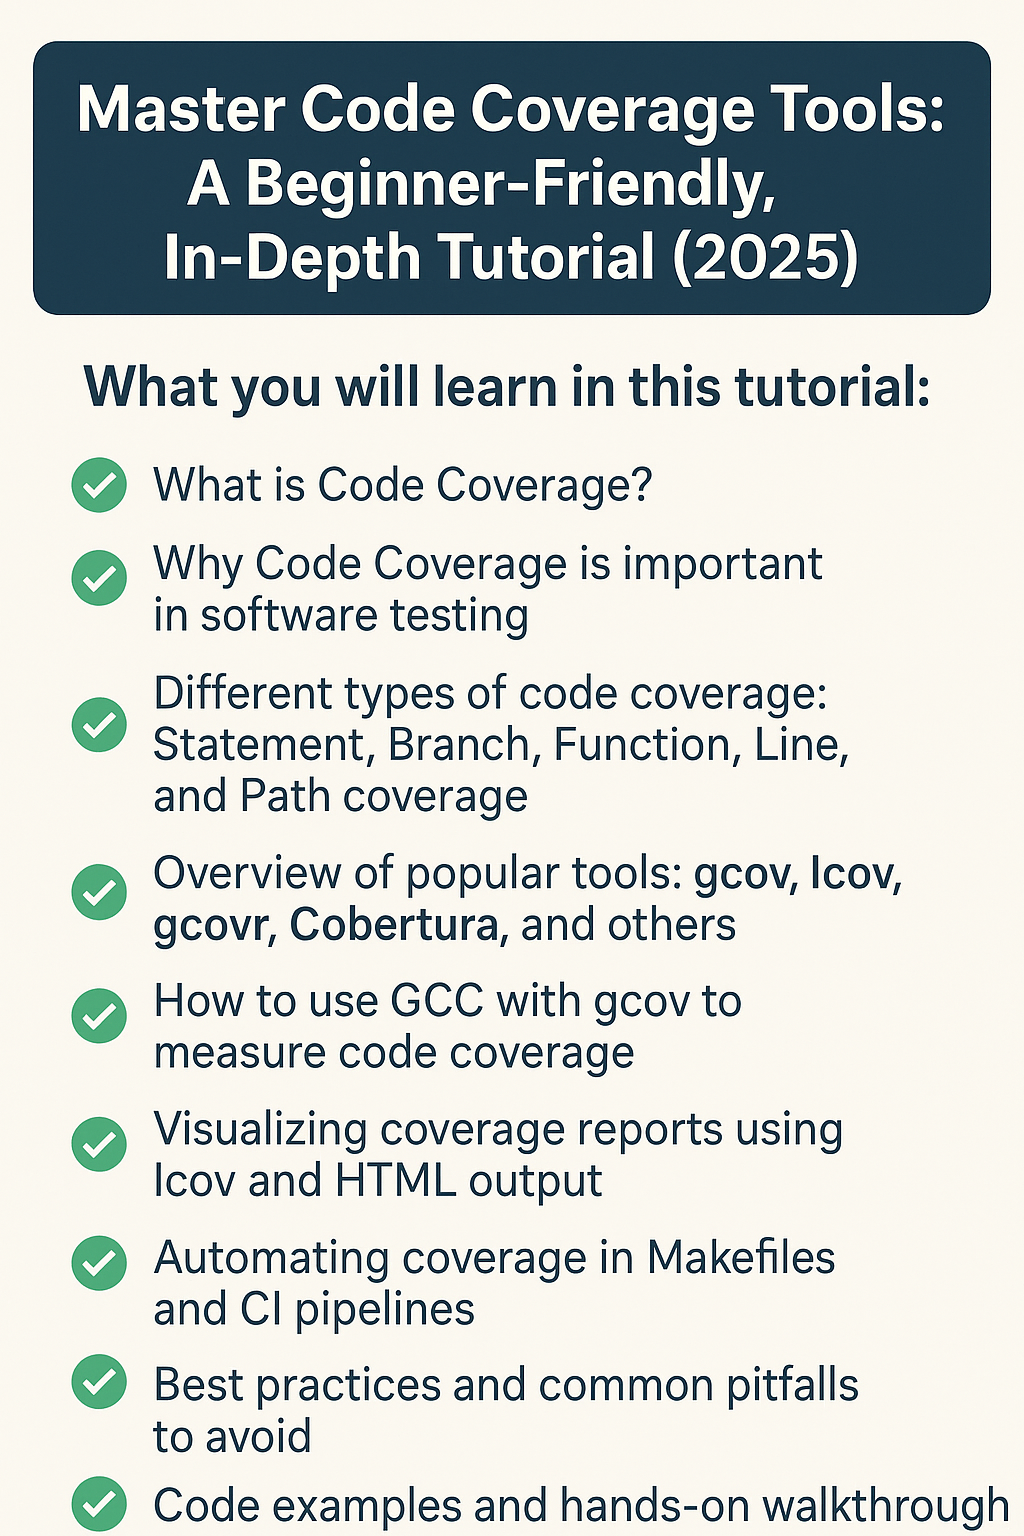
Code Coverage Tools : In this comprehensive and beginner-friendly tutorial, we will explore the world of code coverage tools, which play a crucial role in ensuring your software is thoroughly tested and reliable. Whether you’re working on embedded systems, desktop applications, or large-scale software projects, understanding code coverage is essential for improving software quality and identifying untested parts of your codebase.
By the end of this tutorial, you will have a solid understanding of how code coverage tools work and how to integrate them into your own development workflow. Whether you are a student, a developer in testing, or an embedded systems engineer, this guide will empower you to write better-tested and more robust code in 2025 and beyond.
What Is Code Coverage?
Code coverage is a metric used to measure how much of your source code has been executed (or “covered”) during testing. It helps answer questions like:
- Have all functions been tested?
- Have all branches or conditions been exercised?
- Are there any unused lines of code?
In simple terms, code coverage tools help ensure your tests are doing their job.
Why Code Coverage Matters
- ✅ Identifies untested parts of code
- 🚨 Helps find dead code or redundant logic
- 🔍 Improves software reliability
- 📊 Provides quality insights for QA, DevOps, and Developers
- 💬 Useful in code reviews and CI/CD pipelines
Types of Code Coverage Metrics
| Type | Description | Example |
|---|---|---|
| Line Coverage | % of lines executed | 90 out of 100 lines = 90% |
| Function Coverage | % of functions called | 8 of 10 functions = 80% |
| Branch Coverage | % of if/else branches executed | Both if and else parts |
| Condition Coverage | % of boolean sub-expressions tested | if (A && B) tests A and B |
| Path Coverage | % of possible execution paths tested | All loops + conditions |
Popular Code Coverage Tools
| Tool | Language | Platform | Usage |
|---|---|---|---|
| gcov | C/C++ | Linux | Built-in with GCC |
| lcov | C/C++ | Linux | Visual frontend for gcov |
| gcovr | C/C++ | Cross-platform | Outputs XML/HTML |
| JaCoCo | Java | Cross-platform | Java code coverage |
| Coverage.py | Python | Cross-platform | Simple and powerful |
| Istanbul | JavaScript | Node.js | For JS/TS projects |
Tutorial: Using gcov and lcov (For C/C++ Beginners)
Let’s walk through a simple example.
Step 1: Setup a Simple C Program
// file: example.c
#include <stdio.h>

void test_function(int x) {
    if (x > 0)
        printf("Positive\n");
    else
        printf("Non-positive\n");
}

int main() {
    test_function(5);
    return 0;
}
Step 2: Compile with Coverage Flags
gcc -fprofile-arcs -ftest-coverage example.c -o example
Explanation:
-fprofile-arcs– Instruments code to generate branch info.-ftest-coverage– Generates.gcnofile for test info.
Step 3: Run the Program
./example
What happens?
- It runs the code.
- Creates
.gcdafile (stores execution count).
Step 4: Run gcov to See Coverage
gcov example.c
You’ll get output like:
File 'example.c'
Lines executed:80.00%
example.c.gcov created
Look into example.c.gcov – it has line-by-line coverage.
Step 5 (Optional): Visualize with lcov and genhtml
lcov --capture --directory . --output-file coverage.info
genhtml coverage.info --output-directory out
xdg-open out/index.html
Coverage in CI/CD (Advanced Tip)
Use tools like gcovr, lcov, or Codecov in GitHub Actions or Jenkins pipelines to:
- Fail builds if coverage is low
- Track coverage over time
- Generate HTML badges for repos
Understanding Output Files
| File | Purpose |
|---|---|
.gcno | Generated during compilation (static info) |
.gcda | Generated after running executable (runtime info) |
.gcov | Result from combining both (readable format) |
Code Coverage vs Testing
| Concept | Purpose |
|---|---|
| Unit Tests | Check if individual components work |
| Code Coverage | Checks if tests touch all code |
| 🧠 Best Practice: Use both together! |
Common Mistakes to Avoid
- Thinking 100% coverage means no bugs – Not true! Code may run but still produce wrong output.
- Forgetting to run all test cases before measuring – Always execute full test suite first.
- Not cleaning old coverage data – Use
gcovr -r . --deleteor clean.gcdafiles before retesting.
Bonus: gcovr for Easy Automation
pip install gcovr
gcovr --html --html-details -o coverage.html
This tool summarizes all .gcov into HTML – very handy!
Summary
- Code coverage tools help validate testing effectiveness.
- For C/C++,
gcov,lcov, andgcovrare most used. - Compile with coverage flags, execute the binary, then generate reports.
- Visual tools help QA, CI, and reviews.
- Code coverage != code quality but is a crucial metric.
We’ll:
- Write a simple C program.
- Compile it with code coverage flags.
- Run it to generate coverage data.
- Use
gcovto view the coverage. - Optionally, use
lcov+genhtmlto generate an HTML report.
Step-by-Step Code Coverage Example with Code
Step 1: Write the C Program (math_utils.c)
// math_utils.c
#include <stdio.h>

int add(int a, int b) {
    return a + b;
}

int subtract(int a, int b) {
    return a - b;
}

int multiply(int a, int b) {
    return a * b;
}

int divide(int a, int b) {
    if (b == 0) {
        printf("Division by zero error!\n");
        return 0;
    }
    return a / b;
}

int main() {
    printf("Add: %d\n", add(5, 3));
    printf("Subtract: %d\n", subtract(5, 3));
    // multiply and divide not called

    return 0;
}
Step 2: Compile with Coverage Flags
gcc -fprofile-arcs -ftest-coverage math_utils.c -o math_utils
This creates extra files like
math_utils.gcno(for structure data).
Step 3: Run the Program
./math_utils
Output:
Add: 8
Subtract: 2
This execution will generate
math_utils.gcda(runtime data file showing which lines ran).
Step 4: Run gcov to See Coverage
gcov math_utils.c
You’ll see something like:
File 'math_utils.c'
Lines executed:60.00% of 15
Creating 'math_utils.c.gcov'
Then open the file math_utils.c.gcov:
        -:    1: // math_utils.c
        -:    2: #include <stdio.h>
    #####:    3:
        1:    4: int add(int a, int b) {
        1:    5:     return a + b;
        -:    6: }
        1:    7:
        1:    8: int subtract(int a, int b) {
        1:    9:     return a - b;
        -:   10: }
    #####:   11: int multiply(int a, int b) {
    #####:   12:     return a * b;
        -:   13: }
    #####:   14: int divide(int a, int b) {
    #####:   15:     if (b == 0) {
    #####:   16:         printf("Division by zero error!\n");
    #####:   17:         return 0;
    #####:   18:     }
    #####:   19:     return a / b;
        -:   20: }
        1:   21:
        1:   22: int main() {
        1:   23:     printf("Add: %d\n", add(5, 3));
        1:   24:     printf("Subtract: %d\n", subtract(5, 3));
        -:   25:     // multiply and divide not called
        1:   26:     return 0;
        -:   27: }
What You Learn From This
- Lines marked
#####: <line number>are never executed. - Functions not tested = 0% coverage.
- You only called
add()andsubtract()inmain()– so only those got executed.
Bonus: Generate Visual Report with lcov + genhtml
Step 1: Install lcov
sudo apt install lcov
Step 2: Collect Coverage Info
lcov --capture --directory . --output-file coverage.info
Step 3: Generate HTML Report
genhtml coverage.info --output-directory out
Step 4: Open Report
xdg-open out/index.html
You’ll see a colorful, user-friendly HTML page showing function/line/branch coverage.
Summary
✅ Code coverage tools like gcov and lcov help track which parts of your code were tested.
✅ Use flags -fprofile-arcs -ftest-coverage during compilation.
✅ gcov gives line-by-line coverage in plain text.
✅ lcov + genhtml gives interactive HTML reports.
✅ Helps you spot untested functions (like multiply() and divide() above).
You can also Visit other tutorials of Embedded Prep
- What is eMMC (Embedded MultiMediaCard) memory ?
- Top 30+ I2C Interview Questions
- Bit Manipulation Interview Questions
- Structure and Union in c
- Little Endian vs. Big Endian: A Complete Guide
- Merge sort algorithm
Special thanks to @mr-raj for contributing to this article on EmbeddedPrep
Mr. Raj Kumar is a highly experienced Technical Content Engineer with 7 years of dedicated expertise in the intricate field of embedded systems. At Embedded Prep, Raj is at the forefront of creating and curating high-quality technical content designed to educate and empower aspiring and seasoned professionals in the embedded domain.
Throughout his career, Raj has honed a unique skill set that bridges the gap between deep technical understanding and effective communication. His work encompasses a wide range of educational materials, including in-depth tutorials, practical guides, course modules, and insightful articles focused on embedded hardware and software solutions. He possesses a strong grasp of embedded architectures, microcontrollers, real-time operating systems (RTOS), firmware development, and various communication protocols relevant to the embedded industry.
Raj is adept at collaborating closely with subject matter experts, engineers, and instructional designers to ensure the accuracy, completeness, and pedagogical effectiveness of the content. His meticulous attention to detail and commitment to clarity are instrumental in transforming complex embedded concepts into easily digestible and engaging learning experiences. At Embedded Prep, he plays a crucial role in building a robust knowledge base that helps learners master the complexities of embedded technologies.