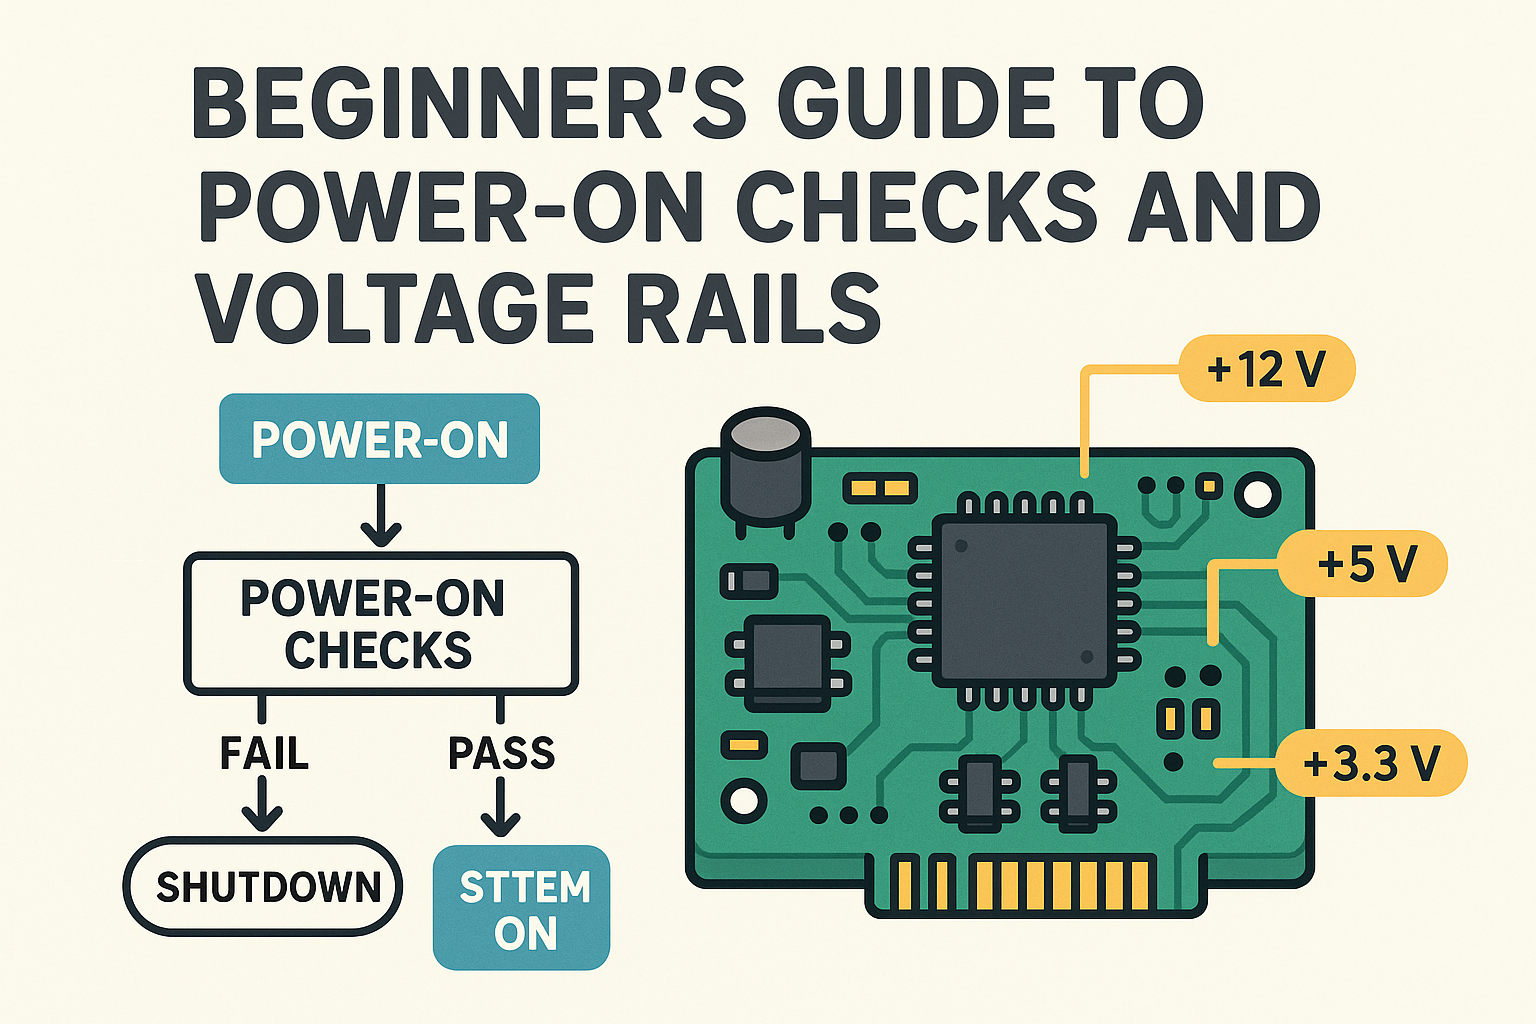
Power-On Checks and Voltage Rails Beginner’s Guide 2025 : When you build or work with electronic circuits or embedded systems, one of the first things to understand is how to safely power up your system and verify that it’s working correctly. That’s where Power-On Checks and Voltage Rails come into play.
This article will guide you step-by-step through the concepts, checks, and best practices — no prior experience needed!
What Are Voltage Rails?
Simple Definition:
Voltage rails are the different voltage levels used in a circuit to power various components. They act like electrical highways, delivering the right amount of voltage where it’s needed.
Common Voltage Rails:
| Voltage Rail | Typical Use |
|---|---|
| 3.3V | Microcontrollers, sensors |
| 5V | USB devices, older microcontrollers |
| 12V | Motors, relays, some displays |
| 1.8V / 1.2V | CPUs, RAM, SoCs (in modern systems) |
Think of each rail like a water pipe with a different pressure level. Some parts need more pressure (voltage), while others only need a trickle.
Why Power-On Checks Matter
Power-On Checks are like a health checkup for your hardware. The goal is to catch issues early before components get damaged or behave unpredictably.
Imagine plugging in a device and:
- It doesn’t turn on.
- It heats up.
- It resets frequently.
These symptoms could be caused by power problems—a short circuit, wrong voltage, or unstable power supply. That’s why checking your voltage rails and power sequence is crucial.
Step-by-Step Power-On Checks
Here’s a beginner-friendly checklist to follow when powering up your hardware:
1. Visual Inspection
Before even connecting power:
- Look for solder bridges or loose wires.
- Ensure polarity is correct (especially on capacitors and diodes).
- Check IC orientation (pin 1 should match the marking on the PCB).
2. Continuity Test (Pre-Power)
Use a multimeter in continuity mode to:
- Test power and ground lines are not shorted.
- Ensure all ground points are connected.
- Check that critical components like regulators or microcontrollers are not directly shorted.
💡 Tip: A short between VCC and GND is a red flag. Fix it before applying power!
3. Apply Power through a Current-Limited Supply
Use a bench power supply with current limiting enabled (start with ~100–300 mA limit).
- If current spikes immediately: There might be a short.
- If current stays low and stable: Proceed to check voltages.
4. Check All Voltage Rails
Use a multimeter to verify each rail is within expected range. For example:
| Expected Rail | Acceptable Range |
|---|---|
| 3.3V | 3.2V to 3.4V |
| 5V | 4.8V to 5.2V |
| 1.8V | 1.75V to 1.85V |
Small deviations are okay, but large mismatches can damage parts or cause instability.
5. Observe Power-On Sequence (Advanced)
Some systems need a specific order of powering components (e.g., core voltage before IO voltage). This is common in CPUs, FPGAs, and SoCs.
Use an oscilloscope or power sequence controller (if available) to verify:
- Each rail turns on at the correct time.
- There is proper delay between rails.
Not all projects need this, but it’s critical in complex boards.
6. Check for Heat and Behavior
After powering up:
- Feel (carefully) for any hot components.
- Watch LEDs or displays for signs of life.
- Use UART or debug port to check for boot messages.
Tools You’ll Need
| Tool | Purpose |
|---|---|
| Multimeter | Measure voltage, continuity, resistance |
| Bench Power Supply | Controlled and safe power source |
| Oscilloscope (optional) | Visualize voltage behavior over time |
| IR Thermometer / Finger | Check for overheating components |
Bonus: Tips for Clean Power Design
- Use decoupling capacitors near each IC (usually 0.1uF).
- Keep power and ground traces wide and short.
- Use ferrite beads to reduce high-frequency noise.
- Add test points on each rail for easy voltage checks.
Summary
Power-on checks and voltage rails may sound intimidating, but once you break them down, they’re just common-sense safety steps. Here’s what to remember:
✅ Check visually and with a multimeter before applying power
✅ Use current-limited power supply to prevent damage
✅ Verify each voltage rail is in the expected range
✅ Watch for signs of short circuits or overheating
✅ Understand power sequencing in complex systems
Clock Signal Verification
In the world of embedded systems and digital electronics, the clock signal is the heartbeat of the system. Just like humans rely on a regular pulse to stay alive, microcontrollers, processors, and other digital ICs rely on clock pulses to stay synchronized and perform their tasks.
This guide will walk you through everything you need to know about Clock Signal Verification—what it is, why it matters, and how to perform it effectively.
What is a Clock Signal?
A clock signal is a periodic square wave that tells digital devices when to perform an operation. It defines the timing for data transfer, instruction execution, and communication.
Typical sources of clock signals include:
- Crystal oscillators (e.g., 8 MHz, 16 MHz)
- MEMS oscillators
- Internal PLLs (Phase Locked Loops)
- External clock generators
Why Clock Signal Verification is Important
Imagine this:
- Your microcontroller isn’t booting.
- Your sensor interface is glitchy.
- Your processor outputs junk over UART.
Clock issues could be the hidden culprit.
Verifying the clock ensures:
- Your main system clock is running.
- All peripherals (UART, SPI, I2C, etc.) are receiving the correct timing.
- The timing constraints of high-speed interfaces (like DDR, USB) are being met.
When to Verify Clock Signals
You should check clock signals during:
- Board bring-up (initial power-on testing of a new PCB)
- After reflow soldering or manual assembly
- When debugging issues like:
- Unresponsive MCUs
- Communication protocol failures
- Random resets or boot failures
Tools for Clock Signal Verification
| Tool | Purpose |
|---|---|
| Oscilloscope | To visualize the clock waveform |
| Logic Analyzer | To confirm clock presence and frequency |
| Multimeter (limited use) | To check voltage on oscillator pins |
| JTAG/SWD Interface | For register-level clock verification |
| Oscillator Datasheets | To know expected behavior (voltage, frequency, tolerance) |
Step-by-Step Clock Signal Verification
1. Visual Inspection First
- Ensure the crystal oscillator is properly soldered.
- Check for orientation (some crystals have polarity).
- Verify loading capacitors are placed correctly and values match datasheet.
2. Check Power to Oscillator
- Measure VDD on the oscillator chip or pins using a multimeter.
- Check for correct voltage rail (e.g., 3.3V or 1.8V).
- If using an active oscillator (MEMS or clock IC), it needs power!
3. Use an Oscilloscope to Probe Clock Pins
- Probe the output pin of the crystal oscillator or clock generator.
- Set your oscilloscope to a time base that fits your expected frequency.
- Look for a stable square wave or sine wave, depending on the oscillator type.
For example:
| Expected Clock | What You Should See |
|---|---|
| 16 MHz crystal | 16 MHz square/sine wave |
| 100 MHz MEMS oscillator | 100 MHz square wave |
| 32.768 kHz RTC crystal | Low frequency sine wave (careful, hard to probe due to low amplitude) |
🔍 Tip: Small crystals (like 32.768 kHz) can be difficult to probe directly; use test points or buffered outputs.
4. Measure Frequency and Duty Cycle
On the oscilloscope:
- Use the frequency measurement tool.
- Measure duty cycle (typically ~50% for square waves).
- Check peak-to-peak voltage to ensure it’s within the logic level range.
🧠 A 3.3V logic clock should swing from 0V to ~3.3V.
5. Check Clock Enable Pins and Register Settings
Some MCUs and SoCs require:
- A software register to enable clocks.
- An external enable pin (CLK_EN, OE).
Using a debug probe or serial output, verify if:
- Clock configuration registers are set correctly.
- PLLs are locked and active.
- Clock gates are open (not disabled for power saving).
6. Verify Internal Clock Output (If Available)
Some MCUs (e.g., STM32, ESP32) allow routing internal clocks to a GPIO pin for measurement:
- Use this feature to measure internal PLL or system clock output externally.
- Verify that internal configuration (multipliers, dividers) match expected system frequency.
Common Clock Issues
| Problem | Possible Cause |
|---|---|
| No clock output | Crystal not oscillating, wrong load caps, missing power |
| Incorrect frequency | Wrong PLL settings, damaged oscillator |
| No MCU boot | Clock not reaching CPU core |
| Peripheral errors | Missing or misconfigured peripheral clock |
| Clock jitter/noise | Poor PCB layout, no ground shielding |
Tips for Reliable Clock Design
- Use ground planes under clock traces.
- Keep clock traces short and matched (for differential pairs).
- Avoid routing clock signals near noisy digital lines.
- Add series resistors (22–33Ω) if ringing is observed.
- Use decoupling capacitors near oscillators.
Summary
Clock signal verification is a fundamental part of bringing up and maintaining embedded hardware. A missing or misbehaving clock can halt your entire system — and it’s often overlooked.
Here’s your quick checklist:
✅ Visual inspection
✅ Measure power to the oscillator
✅ Probe clock signal with an oscilloscope
✅ Check frequency, duty cycle, and voltage swing
✅ Verify enable pins and internal configuration
Reset Circuit Validation
In embedded systems, a reset is like a clean slate—it initializes the system to a known state, clearing registers, restarting firmware, and ensuring predictable startup. Just like rebooting your PC fixes odd behavior, reset circuits ensure embedded hardware starts properly and safely.
But how do you make sure the reset circuit is working correctly? That’s where Reset Circuit Validation comes in.
This article will guide you through what a reset circuit is, why it matters, and how to validate it thoroughly using beginner-friendly steps.
What is a Reset Circuit?
A reset circuit is a hardware block that generates a signal (usually active-low, called RESET#) to restart the system or bring it to a known state. It’s often connected to:
- Microcontrollers (MCUs)
- Microprocessors (MPUs)
- FPGAs
- Power Management ICs (PMICs)
Types of Reset Sources:
- Power-On Reset (POR) – Triggered when power is first applied
- Manual Reset – Triggered by pressing a reset button
- Brown-Out Reset (BOR) – Triggered by low voltage conditions
- Watchdog Reset – Triggered by software timeout
- External Reset ICs – Dedicated chips like TPS3823, ADM809, etc.
Why Validate the Reset Circuit?
An unreliable reset circuit can lead to:
- MCU not starting
- Unpredictable behavior during power-on
- Boot looping
- Flash corruption
Validating the reset ensures:
- The system starts cleanly
- All devices come out of reset in proper sequence
- There’s enough hold time for the system to stabilize
Components in a Reset Circuit
| Component | Purpose |
|---|---|
| Pull-up resistor | Pulls RESET# line high when not active |
| Reset IC | Generates reset pulse after power is stable |
| Capacitor | Delays reset signal (RC delay) |
| Push button | Allows manual reset |
| Open-drain drivers | Allow multiple devices to pull RESET# low |
How to Perform Reset Circuit Validation – Step-by-Step
Step 1: Visual Inspection
- Check for missing or misaligned components (especially reset ICs, buttons).
- Ensure no solder bridges between reset line and ground or VCC.
- Verify pull-up resistor value (typically 10kΩ).
Step 2: Check Default State on Power-Up
- Power on the board.
- Use a multimeter or oscilloscope to probe the RESET# line.
- Expected behavior:
- RESET# stays LOW for a short duration (e.g., 100ms) on power-up.
- Then goes HIGH and stays there (allowing MCU to run).
Step 3: Measure Reset Pulse Timing
Using an oscilloscope, check:
- Duration of reset pulse (T_reset)
- It should meet MCU datasheet requirement (e.g., >40ms)
- Rise time of the signal (should be fast and clean)
If the pulse is too short or noisy, MCU may not boot.
Step 4: Test Manual Reset Button
- Press and hold the reset button.
- Observe RESET# go LOW.
- Release the button — RESET# should return HIGH cleanly.
Verify debounce behavior:
- Add a capacitor (~0.1µF) across the button if signal is noisy.
- Check for proper mechanical contact.
Step 5: Validate Voltage Thresholds
If using a reset IC, check:
- Supply voltage (Vcc) to the IC is within its operating range.
- Output toggles correctly when Vcc drops below threshold.
Use a variable power supply to simulate brown-out and verify the IC asserts RESET# below, say, 2.9V if using TPS3823-33.
Step 6: Simulate Watchdog Timeout (If Used)
If your system includes a watchdog:
- Avoid “feeding” the watchdog in software.
- Ensure the reset line toggles after the timeout.
- Measure the duration of the watchdog reset pulse.
Step 7: Check System Behavior After Reset
After each reset:
- MCU or processor should boot correctly.
- Peripherals should reinitialize.
- Debug interface (like SWD/JTAG) should remain functional.
Use serial logs, LEDs, or debug probes to confirm proper behavior.
Common Reset Circuit Issues and Fixes
| Issue | Possible Cause | Fix |
|---|---|---|
| MCU doesn’t boot | No reset pulse, stuck low | Check reset IC or button |
| Boot loops | Reset pulse too short | Increase capacitor or fix RC delay |
| Random resets | Noisy reset line | Add filtering capacitor |
| Reset not asserted on brown-out | Wrong threshold | Choose correct reset IC |
| Shared reset doesn’t work | Improper open-drain configuration | Add buffer or diode isolation |
Tips for Reliable Reset Design
- Use RC delay circuits for simple systems.
- Prefer dedicated reset supervisors for precise control.
- Isolate noisy components from the reset line.
- Keep trace lengths short, especially for manual reset lines.
- Add test points or headers for debug access.
Summary
Reset circuit validation is a small but crucial step during embedded hardware bring-up. A poorly designed or untested reset path can cause hours of frustrating debug time.
Quick Checklist:
- Check pull-ups and reset IC orientation
- Probe RESET# line during power-on
- Validate reset timing with oscilloscope
- Test manual and watchdog resets
- Ensure system boots cleanly after reset
Boot Logs & Serial Debugging
When your embedded device starts up and you’re left staring at a silent board, one of your best friends is the serial debug port. It can speak volumes—literally—about what’s going right (or wrong). Understanding boot logs and how to use serial debugging can help you bring up hardware, debug early firmware issues, and even fix bootloader problems.
In this guide, we’ll walk you through what boot logs are, how to access them using a serial connection, how to interpret them, and how to troubleshoot issues step-by-step.
What Are Boot Logs?
Boot logs are the messages printed by a system (often via UART/serial port) as it powers up. These logs include:
- Bootloader messages (e.g., U-Boot)
- Kernel initialization (Linux/RTOS/other OS)
- Driver loading
- Application startup logs
Think of them as the system’s heartbeat—a real-time transcript of what it’s doing during boot.
What Is Serial Debugging?
Serial debugging is a method of communicating with your embedded board through a UART (Universal Asynchronous Receiver-Transmitter) interface. It’s commonly used to:
- View boot logs
- Send commands (e.g., via a terminal)
- Interact with bootloaders or shells
Tools You Need
| Tool | Purpose |
|---|---|
| USB-to-Serial Adapter (e.g., FTDI, CP2102) | Converts USB from your PC to UART |
| Serial Terminal Software (e.g., PuTTY, Tera Term, Minicom, screen) | View and send data |
| Wires or Jumpers | Connect TX, RX, and GND |
| Target Board | Embedded system with UART debug pins |
Wiring – Connecting Your Serial Debug Port
Typical connections:
| USB-to-Serial | Target Board |
|---|---|
| TXD | RX (receive pin) |
| RXD | TX (transmit pin) |
| GND | GND |
❗ Never connect 5V or 3.3V unless required. Most UART debug uses 3.3V TTL logic levels.
How to Set Up Serial Communication
- Connect hardware as shown above.
- Plug USB-to-Serial into your PC.
- Open your terminal software.
- Select the correct COM port (Windows) or /dev/ttyUSB0 (Linux).
- Use these typical serial settings:
- Baud Rate:
115200 - Data Bits:
8 - Parity:
None - Stop Bits:
1 - Flow Control:
None
- Baud Rate:
What Do Boot Logs Look Like?
Here’s a sample boot log from an embedded Linux board:
U-Boot 2023.04 (Apr 2024)

DRAM:  1 GiB
MMC:   mmc@7800000: 0
Loading Environment from MMC...
Booting Linux from mmc 0:1...
Starting kernel ...

[    0.000000] Linux version 5.10.0 (gcc version 9.3.0)
[    0.120000] CPU0: Booted secondary processor
[    1.000000] Mounting root filesystem
[    2.500000] Welcome to Embedded Linux!
How to Read Boot Logs – Common Stages
1. Bootloader Phase (U-Boot or Barebox)
- Initializes RAM, MMC, environment
- Loads the kernel from flash or SD card
- Allows you to interrupt and modify boot (press a key like
EscorSpace)
2. Kernel Phase
- Hardware detection
- Mounting file systems
- Loading drivers
3. User Space Phase
- Starting services (systemd/init)
- Launching applications
Why Boot Logs Are Important
Boot logs help you:
- Detect crash loops
- Identify hardware failures (e.g., NAND, eMMC, SD not found)
- Monitor driver loading issues
- Debug kernel panics
- Measure boot time
Common Boot Log Issues and What They Mean
| Boot Log Message | Meaning | Fix |
|---|---|---|
Kernel panic - not syncing | Kernel can’t continue | Check rootfs or kernel image |
MMC: no card present | Storage device not found | Reseat SD card, check connections |
Failed to mount root fs | Filesystem missing | Rebuild or reflash rootfs |
No console found | Output device not set | Add console=ttyS0 to bootargs |
Serial Debugging in Action – Use Cases
- Interrupt Bootloader
- Press key during countdown (e.g.,
Hit any key to stop autoboot) - Use commands like:
printenv boot load mmc 0:1 0x82000000 zImage
- Press key during countdown (e.g.,
- Log Application Errors
- Use
printf()in C orcoutin C++ to log debug messages - Output will appear on serial terminal
- Use
- Send Commands to Target
- Login to shell (
rootuser) - Run scripts, reboot, kill processes
- Login to shell (
Tips for Effective Serial Debugging
- Always label TX/RX/GND pins on your board.
- Add a pull-up resistor on RX if signal is unstable.
- Check kernel bootargs in U-Boot:
console=ttyS0,115200 root=/dev/mmcblk0p2 - Use logging software (like
screen -LorPuttylog) to save logs.
Summary
| What You Learned | Why It Matters |
|---|---|
| What boot logs are | To diagnose system boot behavior |
| How to wire and use serial | Essential for embedded debug |
| How to interpret logs | Helps catch early boot errors |
| Tools needed | USB-to-serial, terminal software |
| Common boot issues | To know where to fix problems |
Flashing Bootloaders and Firmware
Flashing your embedded device for the first time? You might have heard terms like bootloader, firmware, flashing tools, and image files. Don’t worry — we’ll break it all down in simple terms, and show you how flashing works, why it’s needed, and how to do it step-by-step.
What Is Firmware?
Firmware is the low-level software that runs on your embedded device — it’s what controls the hardware and starts your application. Think of it as the brain of the device.
Examples of firmware:
- An LED blinking program on an Arduino
- An embedded Linux system booting on a Raspberry Pi
- A motor control program in a washing machine
What Is a Bootloader?
A bootloader is a small program that runs before your main firmware. It helps with:
- Initializing hardware (RAM, flash)
- Loading firmware into memory
- Supporting features like firmware update over USB, UART, or OTA
Some common bootloaders:
| Bootloader | Used In |
|---|---|
| U-Boot | Linux-based embedded boards (BeagleBone, i.MX, etc.) |
| Grub | Desktop Linux |
| Arduino Bootloader | Arduino boards |
| DFU Bootloader | STM32, ESP32, etc. |
What Does “Flashing” Mean?
Flashing means writing a binary file (bootloader or firmware) into non-volatile memory like flash or EEPROM on your microcontroller or embedded board. Once flashed, the firmware stays there even if power is removed.
What You Need to Flash
Here’s a basic setup checklist:
| Tool/Component | Why It’s Needed |
|---|---|
| Binary File (.bin, .hex, .elf, .img) | The compiled firmware or bootloader |
| Flashing Tool (esptool, STM32CubeProgrammer, avrdude, etc.) | Sends the binary to the device |
| Serial or USB Interface | Connects your PC to the board |
| Power Supply | To power the target device |
| Jumper Wires or Buttons | For boot mode or reset control |
Flashing: Step-by-Step Overview
Let’s break it into steps using a general example.
Step 1: Prepare the Binary File
Compile your project and get the output file, like:
main.hexormain.bin– firmwareu-boot.img– bootloaderfirmware.elf– executable (used internally or for debugging)
Step 2: Set Boot Mode (if required)
Some microcontrollers require entering bootloader or flash mode before accepting new firmware. This is done by:
- Holding a BOOT button while pressing RESET
- Toggling jumpers (e.g., BOOT0/BOOT1 on STM32)
- Using specific UART/USB commands
Step 3: Connect to PC
- Use USB cable (if your board supports USB flashing)
- Or USB-to-Serial adapter to connect to RX, TX, and GND
⚠️ Make sure your board has drivers installed (CP2102, CH340, FTDI, etc.)
Step 4: Use Flashing Tool
Here are some examples based on popular platforms:
Arduino
# Happens automatically when you click 'Upload' in Arduino IDE
ESP32 / ESP8266
esptool.py --chip esp32 --port /dev/ttyUSB0 write_flash 0x1000 firmware.bin
STM32 (using STM32CubeProgrammer)
- Select the correct COM port or ST-Link
- Load
.binor.hexfile - Set address (usually 0x08000000)
- Click “Start Programming”
BeagleBone / Raspberry Pi (for SD card images)
sudo dd if=linux_image.img of=/dev/sdX bs=4M status=progress
Replace
/dev/sdXwith your SD card path (⚠️ double-check it!)
Step 5: Verify Flashing
Some tools auto-verify. If not, you can:
- Use
verifyoption in the flashing tool - Boot the board and check serial logs
- Blink an LED as a success indicator
Step 6: Reset and Boot
After flashing:
- Press the RESET button, or
- Power cycle the board
Now, the bootloader or firmware will start executing from flash memory.
Common Flashing Errors and Fixes
| Error | Possible Cause | Fix |
|---|---|---|
Permission denied | Insufficient privileges | Use sudo on Linux |
Cannot open port | Wrong COM port or in use | Close serial terminal |
Timeout waiting for response | Not in flash mode | Recheck BOOT mode |
Bad flash address | Incorrect offset | Use correct memory address (e.g., 0x08000000) |
Tips for Beginners
- Always backup your working firmware before flashing.
- Double-check the target chip and flash offsets.
- Use verified cables and adapters.
- If flash fails, try using lower baud rates.
- Use LEDs or serial logs to confirm firmware execution.
Summary
| Concept | Meaning |
|---|---|
| Bootloader | First code that runs and helps load firmware |
| Firmware | Main application running on the board |
| Flashing | Writing firmware or bootloader into memory |
| Tools | esptool, avrdude, STM32Cube, dd, etc. |
| Interfaces | USB, UART, JTAG, SWD |
Verifying Peripheral Functionality
In embedded systems, peripherals are the external or internal devices connected to your microcontroller, such as LEDs, sensors, UART, SPI, I2C, ADC, etc. After powering up your board and flashing the firmware, the next step is to verify whether these peripherals are working correctly.
This guide will walk you through what peripheral verification means, why it’s important, and how to do it step by step.
What Are Peripherals?
Peripherals are the hardware modules that interact with the microcontroller to provide input/output capabilities. They can be:
| Type | Examples |
|---|---|
| Internal | GPIO, ADC, PWM, Timers, UART |
| External | Sensors, Displays, EEPROM, Motors |
These peripherals allow your embedded system to sense, communicate, and control the environment.
Why Is Peripheral Verification Important?
Verifying peripherals ensures:
- Your firmware and drivers are working as expected
- The hardware is properly connected and powered
- There are no configuration mistakes in clock, I/O, or protocols
- You can proceed confidently to higher-level development
Think of it like testing each muscle before a workout — you want to be sure everything is functioning.
General Verification Strategy
Here’s a standard approach to verifying any peripheral:
- Power and Clock Check – Ensure supply voltage and clock signals are correct.
- Pin Configuration – Confirm the correct pin mode (input/output/alternate).
- Minimal Test Code – Write simple code to activate/test the peripheral.
- Use Debugging Tools – Serial output, LEDs, oscilloscopes, logic analyzers.
- Check Expected Behavior – Confirm against datasheets or known output.
Example Walkthroughs
Let’s walk through some basic examples of verifying common peripherals.
1. GPIO (General-Purpose I/O)
Goal: Blink an LED on a specific pin.
// Pseudo-code for GPIO output
pinMode(LED_PIN, OUTPUT);
while (1) {
  digitalWrite(LED_PIN, HIGH);
  delay(500);
  digitalWrite(LED_PIN, LOW);
  delay(500);
}
How to verify:
- LED turns ON and OFF every 0.5 seconds
- If it doesn’t, check the LED polarity, resistor, and pin mapping
2. UART (Serial Communication)
Goal: Print “Hello” over UART to serial monitor.
// Pseudo-code
UART_Init(9600);
UART_Send("Hello from UART!\r\n");
How to verify:
- Open a serial monitor (like PuTTY or Arduino Serial Monitor)
- Set the correct baud rate and COM port
- See if the message appears
Troubleshooting:
- Check RX/TX wiring (they are often crossed)
- Ensure baud rate matches on both ends
3. I2C Communication (e.g., with an OLED or sensor)
Goal: Communicate with an I2C device like a temperature sensor.
I2C_Start();
I2C_Write(DEVICE_ADDR);
I2C_Write(REGISTER_ADDR);
data = I2C_Read();
How to verify:
- Use an I2C scanner to detect the device address
- Read data and print it over UART
- Use a logic analyzer to capture I2C waveform
4. ADC (Analog-to-Digital Converter)
Goal: Read analog voltage on a pin and convert to digital value.
adc_value = ADC_Read(ANALOG_PIN);
voltage = (adc_value * VREF) / 1023.0;
How to verify:
- Connect a known voltage (e.g., from a potentiometer)
- Print the ADC result over UART
- Compare expected vs. actual voltage
5. PWM (Pulse Width Modulation)
Goal: Control the brightness of an LED or motor speed.
PWM_SetDutyCycle(LED_PIN, 50); // 50% brightness
How to verify:
- LED brightness should be dimmer at lower duty cycles
- Use an oscilloscope to check PWM waveform
Debugging Tips for Peripheral Validation
| Issue | Possible Cause | Fix |
|---|---|---|
| No output from UART | Wrong baud rate or TX/RX swap | Check cable, baud rate, and wiring |
| Sensor not responding | Wrong I2C address | Scan I2C bus |
| LED not blinking | Wrong pin or GPIO config | Check circuit and code |
| ADC value stuck | Floating analog input | Use a known voltage or resistor divider |
| PWM not visible | Wrong frequency or timer setup | Use an oscilloscope |
Tools That Help
| Tool | Use |
|---|---|
| Serial Monitor | Print debug messages |
| Multimeter | Measure voltage and signal |
| Oscilloscope | See analog or digital waveforms |
| Logic Analyzer | Debug I2C/SPI/UART buses |
| LEDs | Quick visual indicators |
Best Practices
- Test one peripheral at a time
- Use bare minimum code for verification
- Enable debug logs or serial prints
- Validate hardware wiring visually
- Use datasheets and reference manuals to confirm register settings
Connectivity Tests (USB, Ethernet, CAN)
In embedded systems, connectivity is how your device communicates with the outside world. Whether it’s a USB interface, a network via Ethernet, or real-time communication over CAN, verifying these connections is a crucial step before full application development.
This tutorial walks you through how to test USB, Ethernet, and CAN connections in a simple, step-by-step way.
Why Connectivity Testing Matters
Before you start sending data or building protocols, you need to ensure:
- Hardware is connected correctly
- Firmware drivers are working
- Communication is happening reliably
- No electrical or configuration issues exist
Think of this as a “ping” to test the health of your communication channels.
What You’ll Need
- Development board (e.g., STM32, ESP32, Arduino with CAN module, etc.)
- USB cable, Ethernet cable, or CAN transceivers
- A host PC or second device
- Serial monitor or debugging interface
- Logic analyzer or oscilloscope (optional but helpful)
Section 1: USB Connectivity Test
USB can be used for:
- Serial communication (CDC)
- Mass storage
- HID (e.g., keyboards/mice)
Step-by-Step USB Serial Test (CDC)
- Connect your board via USB
- Use a USB cable with data lines (not just charging).
- Write simple USB serial code
// Example: Send a message via USB serial printf("USB Connected!\r\n"); - Open a Serial Monitor
- Use tools like Arduino IDE Serial Monitor, PuTTY, or Tera Term.
- Set the correct COM port and baud rate.
- Expected Result
- You should see
"USB Connected!"message. - If not:
- Try another cable.
- Check USB driver installation on PC.
- Verify board power and enumeration.
- You should see
Bonus Tip: Check Device Manager (Windows) or lsusb (Linux) to see if the USB device is recognized.
Section 2: Ethernet Connectivity Test
Ethernet is often used for network access, web servers, or IoT communication.
Step-by-Step Ping Test
- Connect an Ethernet cable
- From board to router/switch or directly to PC.
- Configure a static IP in firmware
IPAddress ip(192, 168, 1, 50); // For Arduino-style code Ethernet.begin(mac, ip); - Add a blinking LED or serial print to show successful IP setup
- From your PC, open Terminal and type:
ping 192.168.1.50 - Expected Result
- You get replies from the board’s IP.
- If not:
- Check the IP address range.
- Confirm the cable and LEDs near the Ethernet port.
- Make sure the board has PHY and Ethernet drivers enabled.
Section 3: CAN Bus Connectivity Test
CAN (Controller Area Network) is used in automotive, industrial, and robotic systems for real-time communication.
Prerequisites
- CAN transceiver (e.g., MCP2551, TJA1050)
- Two CAN-capable boards or a board + USB-to-CAN dongle
- Terminating resistors (120Ω at each end of the CAN bus)
Step-by-Step CAN Test
- Wire CAN_H and CAN_L
- Connect both devices’ CAN_H to CAN_H and CAN_L to CAN_L.
- Add 120Ω resistors at both ends of the bus.
- Initialize CAN peripheral in firmware
CAN.begin(500E3); // 500 kbps - Send a test CAN frame
CAN.send(0x123, data, len); // ID = 0x123 - Receive on the other device
if (CAN.available()) { CAN.read(); // Should get ID = 0x123 } - Expected Result
- The second device should receive the same CAN ID and data.
- Use LEDs or serial print to confirm reception.
Bonus Tip:
- Use tools like CANalyzer, CAN-utils, or oscilloscope to monitor CAN frames and waveforms.
Troubleshooting Quick Guide
| Problem | Possible Cause | Fix |
|---|---|---|
| USB not detected | Faulty cable or no data lines | Use a known good USB cable |
| No serial data | Wrong baud rate | Match PC and board baud |
| Ethernet ping fails | Wrong IP or DHCP issue | Use static IP; check cable |
| CAN no data | Missing termination | Add 120Ω resistors |
| CAN error frames | Speed mismatch or wiring | Ensure both nodes use same bitrate |
Summary Table
Interface Testing (UART, I2C, SPI, GPIO)
In embedded systems, interfaces are how microcontrollers talk to other devices—sensors, memory, displays, or even other microcontrollers. This tutorial walks you through basic testing techniques for:
- 🟡 UART (Universal Asynchronous Receiver Transmitter)
- 🔵 I2C (Inter-Integrated Circuit)
- 🟢 SPI (Serial Peripheral Interface)
- 🔴 GPIO (General Purpose Input/Output)
Whether you’re using Arduino, STM32, ESP32, or another board, the concepts are mostly the same.
What You Need
- A microcontroller development board (Arduino, STM32, ESP32, etc.)
- Jumper wires
- A PC with a USB interface
- Optionally: Logic analyzer or multimeter
- Peripheral modules (like I2C/SPI sensors)
1. UART Interface Testing
UART is a serial communication protocol used for debugging and talking to PCs or other UART devices.
Objective:
Send and receive serial data.
Setup:
- Connect USB to your board.
- Open Serial Monitor (Arduino IDE, Tera Term, PuTTY, etc.).
Sample Code (Arduino):
void setup() {
  Serial.begin(9600); // Start UART at 9600 baud
  Serial.println("UART Test Started");
}

void loop() {
  if (Serial.available()) {
    char ch = Serial.read();
    Serial.print("Received: ");
    Serial.println(ch);
  }
}
Expected Result:
Type in the serial monitor → you should see what you typed echoed back.
2. I2C Interface Testing
I2C is used for connecting multiple peripherals (sensors, RTC, EEPROM) with just 2 wires: SDA and SCL.
Objective:
Detect if the I2C device is responding.
Setup:
- Connect I2C device’s SDA/SCL to the board.
- Pull-up resistors (4.7kΩ) might be needed.
- Use a scanner sketch or tool.
I2C Scanner Code (Arduino):
#include <Wire.h>

void setup() {
  Wire.begin();
  Serial.begin(9600);
  Serial.println("I2C Scanner Running...");
}

void loop() {
  for (byte addr = 1; addr < 127; addr++) {
    Wire.beginTransmission(addr);
    if (Wire.endTransmission() == 0) {
      Serial.print("I2C device found at 0x");
      Serial.println(addr, HEX);
    }
  }
  delay(3000);
}
Expected Result:
It prints detected I2C address(es). If nothing is found:
- Check wiring.
- Make sure the device is powered.
- Add pull-up resistors if missing.
3. SPI Interface Testing
SPI is a high-speed protocol used with displays, flash memory, SD cards, etc.
Objective:
Send data to an SPI device and check response.
Common Pins:
- MOSI: Master Out Slave In
- MISO: Master In Slave Out
- SCK: Clock
- CS: Chip Select
Sample SPI Loopback Test (Connect MISO to MOSI):
#include <SPI.h>

void setup() {
  Serial.begin(9600);
  SPI.begin();
  pinMode(10, OUTPUT); // CS pin
  digitalWrite(10, LOW);

  byte sent = 0x55;
  byte received = SPI.transfer(sent);
  Serial.print("Sent: ");
  Serial.print(sent, HEX);
  Serial.print(" | Received: ");
  Serial.println(received, HEX);
}

void loop() {}
Expected Result:
If MISO and MOSI are looped, received data will match sent data.
4. GPIO Interface Testing
GPIO lets you control and read pins directly. You can:
- Blink an LED
- Read a button press
- Toggle a pin high/low
Output GPIO Test:
void setup() {
  pinMode(13, OUTPUT); // Built-in LED on most boards
}

void loop() {
  digitalWrite(13, HIGH); // LED ON
  delay(500);
  digitalWrite(13, LOW); // LED OFF
  delay(500);
}
Input GPIO Test:
Connect a button between pin and GND.
void setup() {
  pinMode(2, INPUT_PULLUP);
  Serial.begin(9600);
}

void loop() {
  if (digitalRead(2) == LOW) {
    Serial.println("Button Pressed");
  }
}
Expected Result:
LED blinks in output test, and serial monitor prints “Button Pressed” in input test.
Tools You Can Use
| Tool | Use |
|---|---|
| Serial Monitor | UART testing |
| I2C Scanner | Check device addresses |
| Logic Analyzer | View waveforms (I2C/SPI) |
| Multimeter | Check voltage on GPIO pins |
| Oscilloscope | Signal integrity and timing |
Common Debug Tips
| Issue | Possible Fix |
|---|---|
| No UART output | Wrong baud rate or COM port |
| No I2C device | Bad wiring or missing pull-ups |
| SPI fail | Check MISO/MOSI/SCK/CS wiring |
| GPIO not working | Check pinMode and wiring |
Summary Table
| Interface | Wires | Use Case | Test Tip |
|---|---|---|---|
| UART | TX, RX | Serial logs, debug | Use serial monitor |
| I2C | SDA, SCL | Sensors, EEPROM | Run I2C scanner |
| SPI | MOSI, MISO, SCK, CS | Displays, memory | Loopback MISO-MOSI |
| GPIO | Varies | LED, buttons | Blink/test logic |
You can also Visit other tutorials of Embedded Prep
- What is eMMC (Embedded MultiMediaCard) memory ?
- Top 30+ I2C Interview Questions
- Bit Manipulation Interview Questions
- Structure and Union in c
- Little Endian vs. Big Endian: A Complete Guide
- Merge sort algorithm
Special thanks to @mr-raj for contributing to this article on EmbeddedPrep
Mr. Raj Kumar is a highly experienced Technical Content Engineer with 7 years of dedicated expertise in the intricate field of embedded systems. At Embedded Prep, Raj is at the forefront of creating and curating high-quality technical content designed to educate and empower aspiring and seasoned professionals in the embedded domain.
Throughout his career, Raj has honed a unique skill set that bridges the gap between deep technical understanding and effective communication. His work encompasses a wide range of educational materials, including in-depth tutorials, practical guides, course modules, and insightful articles focused on embedded hardware and software solutions. He possesses a strong grasp of embedded architectures, microcontrollers, real-time operating systems (RTOS), firmware development, and various communication protocols relevant to the embedded industry.
Raj is adept at collaborating closely with subject matter experts, engineers, and instructional designers to ensure the accuracy, completeness, and pedagogical effectiveness of the content. His meticulous attention to detail and commitment to clarity are instrumental in transforming complex embedded concepts into easily digestible and engaging learning experiences. At Embedded Prep, he plays a crucial role in building a robust knowledge base that helps learners master the complexities of embedded technologies.