
SWD Serial Wire Debug : When working with microcontrollers, debugging is a key part of development. One common way to debug embedded systems is using SWD, short for Serial Wire Debug. It’s a modern, efficient way to communicate with a microcontroller during development.
Let’s break it down in a simple way.
What is SWD Serial Wire Debug?
Serial Wire Debug (SWD) is a two-wire protocol developed by ARM for debugging ARM Cortex-M microcontrollers. It is an alternative to the older JTAG protocol, which uses more pins.
SWD allows you to:
- Load firmware into the microcontroller.
- Set breakpoints and step through code.
- Read and write memory.
- Monitor and control the processor state.
SWD Serial Wire Debug vs JTAG
| Feature | SWD (Serial Wire Debug) | JTAG |
|---|---|---|
| Wires | 2 | 4-5 |
| Speed | Fast | Fast |
| Pin Usage | Low (good for small MCUs) | Higher (more GPIO needed) |
| Complexity | Simpler | More complex |
| Debug Access | Full access | Full access |
So, SWD is preferred when you have limited pins available and are working with ARM-based chips.
How SWD Serial Wire Debug Works
SWD uses only 2 main signals:
- SWDIO – Serial Wire Debug Input/Output
Acts like data line (similar to SDA in I2C). - SWCLK – Serial Wire Clock
Acts like the clock line (similar to SCL in I2C).
Optionally, you might also have:
- nRESET – To reset the microcontroller from the debugger (optional).
- GND – A common ground between your debug tool and target board (mandatory).
Tools Involved
To use SWD, you need:
- A microcontroller that supports SWD (e.g., STM32, NXP, etc.).
- A debug probe, such as:
- ST-Link (for STM32)
- J-Link (Segger)
- CMSIS-DAP
- A debugger software like:
- STM32CubeIDE
- Keil uVision
- OpenOCD with GDB
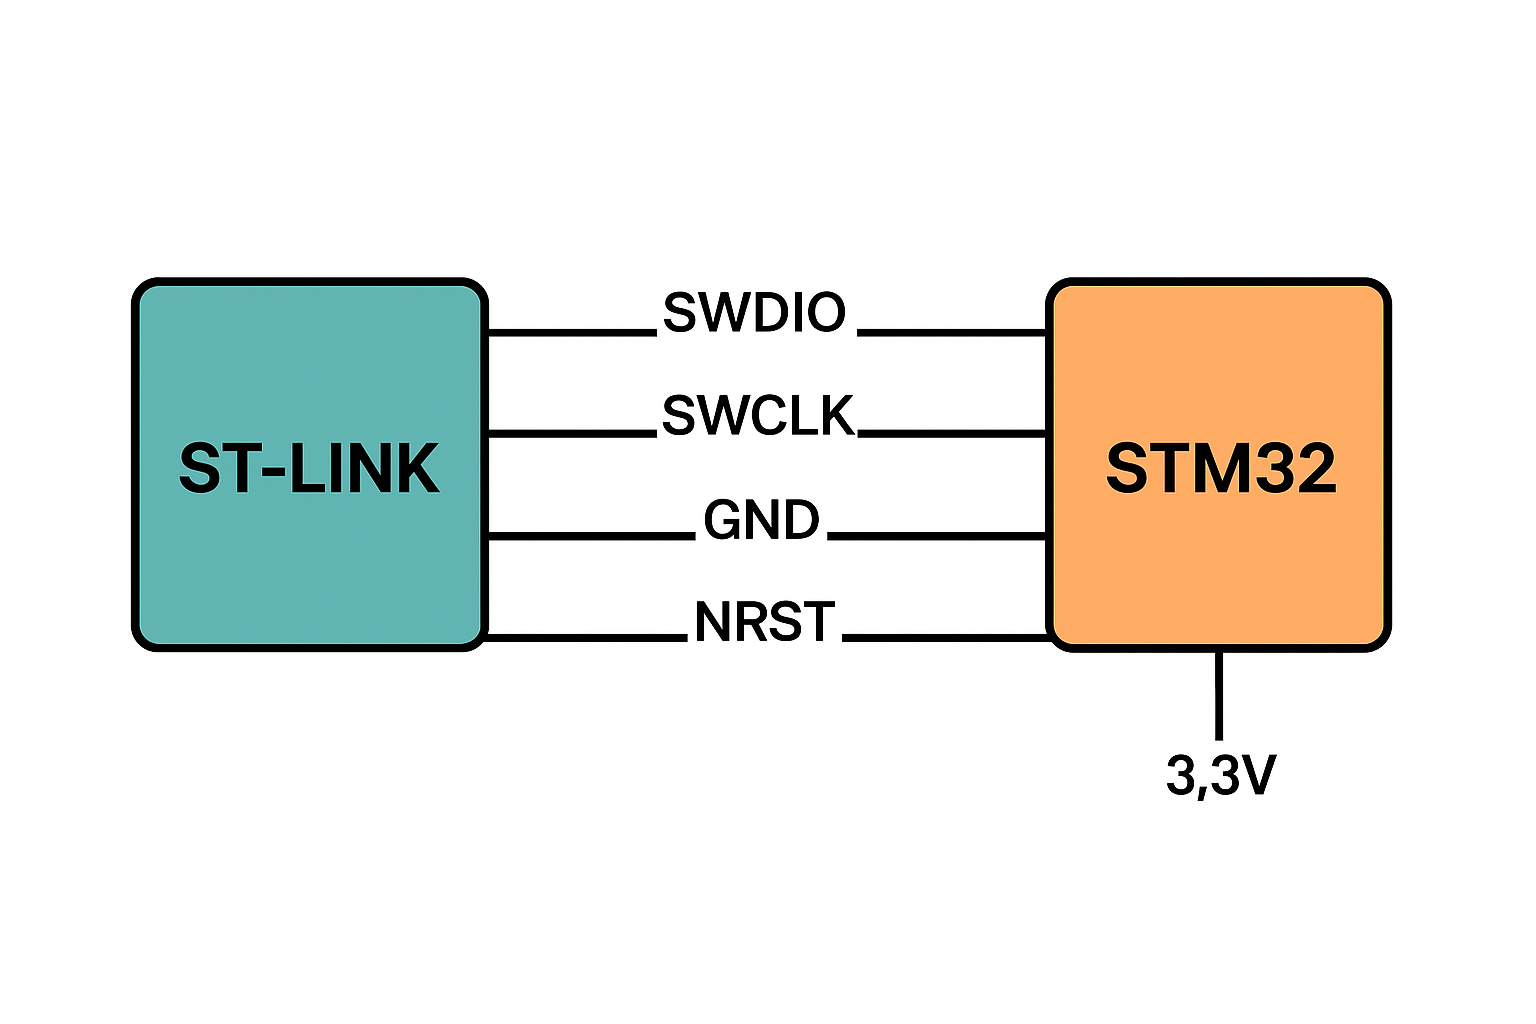
SWD Serial Wire Debug Pinout Example (STM32)
Here’s a common SWD pinout on STM32 boards:
| Pin Name | Function |
|---|---|
| SWDIO | Data |
| SWCLK | Clock |
| GND | Ground |
| 3.3V | Power supply |
| NRST | Reset (optional) |
Why Use SWD?
- 👨💻 Easy Debugging: Load, step, break, and inspect code easily.
- 🧠 Access RAM/Flash: Read/write memory and registers.
- 🔄 Flash Programming: Upload firmware via the debug interface.
- 📉 Fewer Pins: Perfect for space-constrained designs.
- 🧰 Low-Cost Tools: Many low-cost debug probes available.
Real-Life Use Case
Let’s say you’re working with an STM32 microcontroller. You want to flash your code and debug it:
- Connect ST-Link to SWDIO, SWCLK, GND, and optionally NRST.
- Open STM32CubeIDE and start a debug session.
- You can now:
- Set breakpoints in code.
- See variables change in real time.
- Step through the program.
Prerequisites
Before you start, make sure you have:
- ✅ A microcontroller board (e.g., STM32F103, STM32 Nucleo).
- ✅ A debug probe (e.g., ST-Link, J-Link, or CMSIS-DAP).
- ✅ A PC with debugging software installed (e.g., STM32CubeIDE, Keil uVision, OpenOCD + GDB).
- ✅ Wires or a USB cable to connect the debugger.
- ✅ Basic USB driver for the debug probe installed.
💛 Support Embedded Prep
If you find our tutorials helpful and want to support our mission of sharing high-quality embedded system knowledge, you can contribute by buying us a coffee. Every small contribution helps us keep creating valuable content for learners like you. ☕
Thank you for your support — it truly keeps Embedded Prep growing. 💻✨
Step-by-Step: Connecting SWD
1. Identify SWD Pins on the Microcontroller
Look for the following pins on your MCU or dev board:
SWDIO– Data lineSWCLK– Clock lineGND– GroundNRST– (Optional, Reset line)VCC– Target voltage reference (often 3.3V)
You can find these in the datasheet or board pinout diagram.
2. Connect the Debug Probe
Match these pins between the debugger and the target board:
| Debugger Pin | Target Board Pin |
|---|---|
| SWDIO | SWDIO |
| SWCLK | SWCLK |
| GND | GND |
| NRST (opt.) | NRST |
| VCC (ref.) | 3.3V or 5V |
Ensure you connect GND properly. Without a common ground, SWD won’t work.
3. Power the Target
- Some debug probes (like ST-Link) can provide power.
- Or power the board externally via USB or battery.
Step-by-Step: Debugging
4. Open Your IDE or Debug Software
Examples:
- STM32CubeIDE for STM32
- Keil uVision
- VS Code with GDB + OpenOCD
- Segger Ozone for J-Link
5. Create or Open a Project
- Write or import your embedded C/C++ code.
- Make sure the correct MCU is selected.
- Configure the debugger settings if needed.
6. Build Your Code
- Click Build / Compile.
- Ensure the project compiles without errors.
7. Start Debug Session
- Click Debug (Bug icon).
- Your IDE will flash the firmware to the MCU via SWD.
- It will then pause at
main()(or wherever you’ve set breakpoints).
8. Debugging Features You Can Use
Once debugging starts, you can:
- 🔴 Set breakpoints
- 🔁 Step over/into code
- 🧠 Watch variables and memory
- 🛑 Halt/resume the target
- 🔍 Monitor registers and peripherals
⏹️ 9. Stop Debugging
- Click Terminate or Stop Debugging in the IDE.
Summary
| Step | Action |
|---|---|
| 1 | Identify SWDIO, SWCLK, GND, etc. |
| 2 | Connect debug probe to target board |
| 3 | Power the board |
| 4 | Open IDE and load project |
| 5 | Build the code |
| 6 | Start debug session |
| 7 | Set breakpoints, inspect memory |
| 8 | Stop debug session |
You can also Visit other tutorials of Embedded Prep
- What is eMMC (Embedded MultiMediaCard) memory ?
- Top 30+ I2C Interview Questions
- Bit Manipulation Interview Questions
- Structure and Union in c
- Little Endian vs. Big Endian: A Complete Guide
- Merge sort algorithm
Special thanks to @mr-raj for contributing to this article on EmbeddedPrep
Mr. Raj Kumar is a highly experienced Technical Content Engineer with 7 years of dedicated expertise in the intricate field of embedded systems. At Embedded Prep, Raj is at the forefront of creating and curating high-quality technical content designed to educate and empower aspiring and seasoned professionals in the embedded domain.
Throughout his career, Raj has honed a unique skill set that bridges the gap between deep technical understanding and effective communication. His work encompasses a wide range of educational materials, including in-depth tutorials, practical guides, course modules, and insightful articles focused on embedded hardware and software solutions. He possesses a strong grasp of embedded architectures, microcontrollers, real-time operating systems (RTOS), firmware development, and various communication protocols relevant to the embedded industry.
Raj is adept at collaborating closely with subject matter experts, engineers, and instructional designers to ensure the accuracy, completeness, and pedagogical effectiveness of the content. His meticulous attention to detail and commitment to clarity are instrumental in transforming complex embedded concepts into easily digestible and engaging learning experiences. At Embedded Prep, he plays a crucial role in building a robust knowledge base that helps learners master the complexities of embedded technologies.


Keep on writing, great job!