
GDB GNU Debugger : GDB is a powerful tool used by developers to inspect what’s going on inside a running program or after it crashes. It helps you find and fix bugs by allowing you to pause execution, examine variables, inspect memory, and even step through lines of code.
The GNU Debugger (GDB) is a powerful tool used to debug programs written in various programming languages. It lets you inspect and modify memory, control the execution flow, set breakpoints, and much more to analyze and fix issues in your code.
GDB GNU Debugger

1. Installing GDB
In Red Hat Developer Toolset, the GNU Debugger is part of the devtoolset-9-gdb package, and it’s automatically installed along with the toolset. To get started with GDB, follow these installation steps:
If you’re using the devtoolset-9 toolchain, GDB is already included. Here’s how you can install the necessary packages:
$ scl enable devtoolset-9 'gcc -g -o output_file input_file'This will compile your code with debugging information, making it easier to debug later.
2. Preparing Your Program for Debugging
To compile a C or C++ program with debugging information, use the -g flag with gcc or g++. For example:
For a C program:
$ scl enable devtoolset-9 'gcc -g -o fibonacci fibonacci.c'
For a C++ program:
$ scl enable devtoolset-9 'g++ -g -o output_file input_file'
3. Running GDB
To start debugging your program with GDB, use the following command:
$ scl enable devtoolset-9 'gdb fibonacci'
Once inside GDB, you’ll see a prompt where you can start debugging your program. To exit GDB, simply type:
(gdb) quit
4. Listing Source Code
To view the source code of the program you’re debugging, use the list command in GDB. It will show the first 10 lines of the code. You can also change the number of lines displayed:
(gdb) list
(gdb) set listsize 20  # Show 20 lines instead of 10
5. Setting Breakpoints
A breakpoint is a place where the program will stop, allowing you to inspect the state of your program. You can set a breakpoint at a specific line or function:
(gdb) break file_name:line_number
(gdb) break function_name
For example, to set a breakpoint at line 10:
(gdb) break 10
You can list all breakpoints with:
(gdb) info breakpoints
To remove a breakpoint:
(gdb) clear line_number
6. Running Your Program in GDB
Once you’ve set breakpoints, you can run your program inside GDB:
(gdb) run
If your program needs arguments, you can pass them like this:
(gdb) run arg1 arg2
The program will stop at the first breakpoint or when it encounters an error.
7. Displaying Variable Values
To check the current value of a variable while debugging, use the print command:
(gdb) print variable_name
For example, after stopping at a breakpoint, you can print the value of a variable:
(gdb) print a
(gdb) print b
8. Continuing Execution
To continue the program after hitting a breakpoint, use the continue command:
(gdb) continue
If you want to skip a certain number of breakpoints or stop after a few lines of code, use:
(gdb) continue number
(gdb) step number
The step command allows you to execute a specific number of lines, which is useful when you’re debugging loops or functions.
Example Workflow
- Compile the Program with Debug Info:
$ scl enable devtoolset-9 'gcc -g -o fibonacci fibonacci.c' - Start Debugging with GDB:
$ scl enable devtoolset-9 'gdb fibonacci' - Set Breakpoint at Line 10:
(gdb) break 10 - Run the Program:
(gdb) run - Print Variable Values:
(gdb) print a (gdb) print b - Continue Execution:
(gdb) continue
Let’s work with a simple C code example to demonstrate the use of GDB.
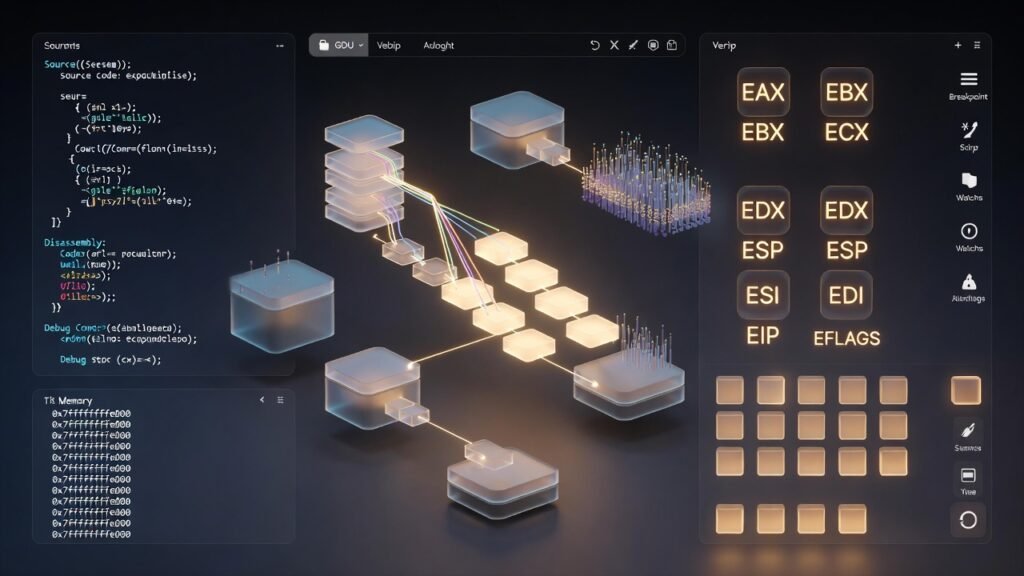
Example C Program: factorial.c
#include <stdio.h>

int factorial(int n) {
    if (n == 0 || n == 1) {
        return 1;
    }
    return n * factorial(n - 1);
}

int main() {
    int num = 5;
    int result = factorial(num);
    printf("Factorial of %d is %d\n", num, result);
    return 0;
}
This program calculates the factorial of 5 and prints the result.
Steps to Debug Using GDB:
- Compile the Program with Debug Information
To compile the C code with debugging symbols, we use the -g option in gcc.
gcc -g -o factorial factorial.c
This will produce an executable file named factorial.
- Start GDB
To start GDB with the compiled program, use the following command:
gdb ./factorial
- Set Breakpoints
We want to set a breakpoint at the factorial function to see the recursive calls.
To set a breakpoint at the factorial function, run the following in the GDB prompt:
(gdb) break factorial
- Run the Program
Now, run the program inside GDB:
(gdb) run
The program will start, and GDB will pause at the first call to factorial.
- Step Through the Code
To step through the code one line at a time, use the step command:
(gdb) step
This will take you inside the factorial function, and you can continue stepping through the function’s execution.
- Display Variable Values
To check the value of the variables, such as n, you can use the print command. For example:
(gdb) print n
This will show the value of n at each step of the recursion.
- Continue Execution
After reaching the breakpoint and checking variable values, you can continue execution until the next breakpoint (or the end of the program):
(gdb) continue
- Exit GDB
Once you’re done, exit GDB by typing:
(gdb) quit
Expected Output
During the debugging session, GDB will allow you to inspect the recursive calls to factorial and the values of n at each step. Eventually, it will display the final result after the program reaches the print statement.
1. GDB Basics and Commands
What is GDB?
GDB is the GNU Debugger. It lets you:
- Start your program and pause it anywhere.
- View variable values at runtime.
- Step through code line by line.
- Set breakpoints (pause points).
- Inspect memory and CPU registers.
How to Compile with Debug Info
Before using GDB, compile your code with debug symbols:
gcc -g main.c -o main
The -g flag tells the compiler to include debug information.
Starting GDB
gdb ./mainCommon Commands
| Command | Description |
|---|---|
run | Starts the program |
break <line/function> | Sets a breakpoint |
next or n | Steps to next line (skips function calls) |
step or s | Steps into a function |
continue or c | Resumes execution |
print <var> | Prints the value of a variable |
list | Shows source code |
quit | Exits GDB |
2. Remote Debugging with GDB
Remote debugging is used to debug a program running on another system (like embedded Linux or RTOS).
Setup
On Target (with GDB server):
gdbserver :1234 ./appOn Host (your PC):
gdb ./app
(gdb) target remote <target-ip>:1234
Now you’re controlling the target program from your host machine.
3. Breakpoints, Watchpoints, Backtrace
Breakpoints
Stop execution at specific lines or functions:
(gdb) break main
(gdb) break 42  # line 42
Watchpoints
Automatically pause when a variable changes:
(gdb) watch counter
Backtrace
See the function call history (call stack):
(gdb) backtrace
This shows which functions were called and in what order.
4. Disassembly and Register Inspection
Disassemble Code
See the machine code for your program:
(gdb) disassemble main
View Registers
See CPU register values (great for low-level debugging):
(gdb) info registers
For ARM/MIPS/other architectures, you’ll see general-purpose and special registers.
5. Debugging on Bare-Metal & RTOS
Bare-Metal Debugging
Bare-metal means there’s no OS — you’re debugging directly on hardware (e.g., ARM Cortex-M microcontroller).
You’ll use:
- A cross-compiler (
arm-none-eabi-gcc) gdbfor that architecture- An OpenOCD or J-Link GDB server
arm-none-eabi-gdb main.elf
(gdb) target remote :3333
(gdb) load  # Load program onto hardware
(gdb) monitor reset init
RTOS Debugging (e.g., FreeRTOS)
RTOS debugging is similar to bare-metal, but you may need:
- RTOS-aware GDB scripts (for thread/task context)
- Special memory maps
You can:
- Pause execution
- View current tasks
- Inspect stack of each thread
GDB extensions/plugins like FreeRTOS-aware GDB scripts can show tasks and queues.
How GDB Interacts with Compiled Binaries
GDB (GNU Debugger) is a tool used to examine and control programs after they are compiled. When you compile a program, the compiler turns your human-readable source code into machine-readable binary code. GDB interacts with these compiled binaries by reading and controlling their execution.
Here’s how it works step-by-step:
- Reading the Binary File
GDB loads the compiled binary file (usually an executable) into memory. If the binary contains debugging information (generated using the-gflag during compilation), GDB can use this information to map machine code back to your original source code, including variables, functions, and line numbers. - Connecting to the Process
GDB can either start a program directly or attach to an already running process. It uses system-level APIs to take control of the process execution. - Controlling Execution
Once attached, GDB can pause program execution (breakpoints), step through code line-by-line (step/next), or continue execution. This allows programmers to inspect exactly how their code is running. - Inspecting Memory and Variables
GDB reads the memory and register states of the running program. This lets you examine variable values, memory contents, and CPU registers to understand the program’s behavior. - Modifying Execution
GDB can also change variable values, set new program counter positions, or modify registers while the program runs. This helps in testing fixes without recompiling.
Key takeaway: GDB bridges the gap between your compiled binary and the original source code, allowing you to inspect, control, and debug the program’s execution at a very deep level.
Breakpoints and Watchpoints in GDB
When debugging with GDB, you often need to pause the program or observe certain events to understand its behavior. That’s where breakpoints and watchpoints come in. They are both tools to stop or monitor a program during execution, but they work differently.
1. Breakpoints
A breakpoint is a marker you set at a specific line of code or function. When the program execution reaches that point, GDB pauses the program so you can inspect the state of the program.
Example use case:
If your program crashes in a function, you can set a breakpoint at the function start to see exactly what happens before the crash.
How to set a breakpoint in GDB:
(gdb) break main   # Break at the start of main()
(gdb) break 25     # Break at line 25 in the current file
When the program hits the breakpoint, GDB stops execution and gives control back to you.
2. Watchpoints
A watchpoint is like a dynamic watch on a variable or memory location. GDB pauses execution whenever the value of that variable or memory changes.
Example use case:
If a variable is changing unexpectedly, you can set a watchpoint on it to find the exact point where the change happens.
How to set a watchpoint in GDB:
(gdb) watch x # Watch variable x
When the watched variable changes, GDB stops execution and shows where the change occurred.
Key Differences Between Breakpoints and Watchpoints
| Feature | Breakpoint | Watchpoint |
|---|---|---|
| Purpose | Stop execution at a specific line or function | Stop execution when a variable or memory changes |
| Trigger | Reaching a specific location in code | Change in the value of a variable or memory |
| Usage | Used to inspect execution flow | Used to monitor specific variable changes |
| Performance | Low impact on performance | Higher performance cost because memory is monitored |
In short:
- Breakpoints → Stop at a specific point in code.
- Watchpoints → Stop when data changes.
Summary
| Feature | GDB Command |
|---|---|
| Set Breakpoint | break <line/function> |
| Step Through Code | next, step |
| Inspect Variable | print var |
| Remote Debug | target remote <ip:port> |
| View Registers | info registers |
| Disassemble | disassemble |
| Watch Variable | watch var |
| Backtrace | backtrace |
Here’s a beginner-friendly, plagiarism-free, and uniquely written explanation of essential GDB commands, complete with simple descriptions and a few helpful tips.
Common GDB Commands You Should Know

| Command | What It Does (Beginner-Friendly) |
|---|---|
run or r | Starts the program from the beginning. Great for testing your code cleanly. |
break or b | Puts a stop (breakpoint) at a specific line or function so you can pause there. |
disable | Temporarily turns off a breakpoint without removing it. Useful for quick toggles. |
enable | Turns a disabled breakpoint back on. Handy if you’re toggling breakpoints often. |
next or n | Moves to the next line of code without entering into any called function. |
step | Goes to the next line, but enters into functions to help debug them deeper. |
list or l | Shows the source code around the current line or a specified location. |
print or p | Shows the current value of a variable. Also great for checking expressions. |
quit or q | Exits GDB. You’ll be asked to confirm if the program is still running. |
clear | Removes all breakpoints, or just one if specified. Good for cleanup. |
continue | Resumes program execution after hitting a breakpoint or stepping through code. |
Example Session (Simple Workflow)
$ gdb ./my_program     # Start GDB with your compiled program
(gdb) break main       # Set a breakpoint at the beginning
(gdb) run              # Start running the program
(gdb) next             # Move to the next line
(gdb) print myVar      # Check the value of a variable
(gdb) continue         # Resume execution until next breakpoint
(gdb) quit             # Exit when you're done

Frequently Asked Questions (FAQ)
1. What is GDB and why is it used?
GDB (GNU Debugger) is a powerful debugging tool used to analyze and debug programs written in languages like C, C++, and others. It helps developers inspect code, find bugs, check variable values, trace program execution, and understand crashes or unexpected behavior.
2. Is GDB only for C/C++ programs?
No! While GDB is widely used for C and C++, it also supports other languages like Ada, Fortran, Go, Rust, and more—depending on compiler support and integration.
3. How do I install GDB?
- Linux: Use your package manager (e.g.,
sudo apt install gdbon Ubuntu). - macOS: Use Homebrew →
brew install gdb. - Windows: Install via MinGW or download pre-built binaries from official sites.
4. Can GDB debug running processes?
Yes! GDB can attach to an already running process using the attach <pid> command, allowing you to debug without restarting the application.
5. What are breakpoints in GDB?
Breakpoints are markers you set in code to pause execution at specific lines or functions. They let you inspect program state, variables, and execution flow at precise points.
Example:
(gdb) break main
6. How do I run a program inside GDB?
Use the run command:
(gdb) run
Or pass arguments like:
(gdb) run arg1 arg2
7. What is a backtrace in GDB?
A backtrace (via the bt command) shows the call stack leading to the current point in execution. It’s very helpful for diagnosing where and how a program crashed.
8. Can GDB be used for remote debugging?
Yes. GDB supports remote debugging over serial ports, TCP/IP, or JTAG interfaces. You use target remote to connect to a remote GDB server.
9. Is GDB suitable for beginners?
Absolutely! While it has a learning curve, GDB is beginner-friendly once you grasp basic commands like break, run, next, step, print, and bt.
10. Are there graphical front-ends for GDB?
Yes. Tools like:
- DDD (Data Display Debugger)
- Eclipse CDT Debugger
- Insight
- GDB Dashboard (TUI enhancements)
These provide graphical interfaces that make debugging visually easier.
11. How can I debug core dumps with GDB?
If your program crashes and generates a core file, you can inspect it like this:
gdb <program> core
This lets you analyze the state of the program at the time of the crash.
12. Is GDB available for free?
Yes! GDB is completely free and open-source, distributed under the GNU General Public License (GPL).
13. What’s new in GDB for 2025?
(Replace this with your blog’s content if you’ve covered new GDB updates. For example:)
- Improved Rust support
- Faster multi-thread debugging
- Better integration with modern IDEs
14. Where can I learn more about GDB?
- Official GDB Manual
- Online tutorials
- Community forums like Stack Overflow
- Your “GDB GNU Debugger | Master Beginner-Friendly Guide (2025)” blog post!
You can also Visit other tutorials of Embedded Prep
- Top 30+ I2C Interview Questions
- Bit Manipulation Interview Questions
- Structure and Union in c
- Little Endian vs. Big Endian: A Complete Guide
- Merge sort algorithm
- Multithreading in C++
- Multithreading Interview Questions
- Multithreading in Operating System
- Multithreading in Java
- POSIX Threads pthread Beginner’s Guide in C/C++
- Speed Up Code using Multithreading
- Limitations of Multithreading
- Common Issues in Multithreading
- Multithreading Program with One Thread for Addition and One for Multiplication
- Advantage of Multithreading
- Disadvantages of Multithreading
- Applications of Multithreading: How Multithreading Makes Modern Software Faster and Smarter”
Special thanks to @mr-raj for contributing to this article on EmbeddedPrrep
Want to estimate your social media income? Try this Facebook Earning Calculator to calculate potential earnings from Facebook content creators.


Leave a Reply